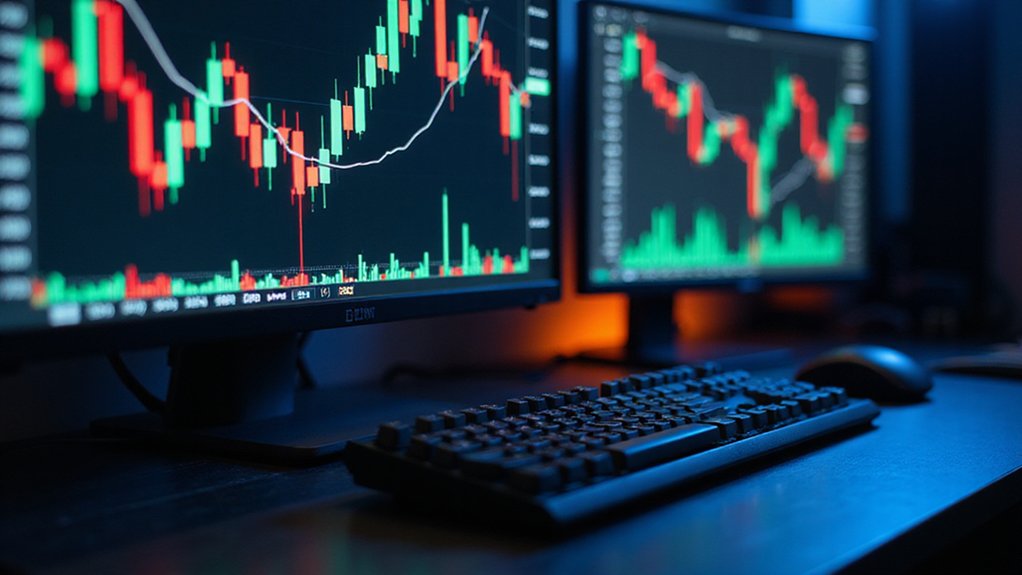

Candlestick charts distill market psychology into visual shorthand that savvy crypto traders can’t afford to ignore. The body reveals the battle between opening and closing prices (green for bullish, red for bearish), while shadows expose the period’s extremes. Patterns like Hammers, Shooting Stars, and Doji candles signal potential reversals or continuations—particularly when confirmed by volume indicators. For truly effective analysis, examine these formations across multiple timeframes; the deeper patterns reveal themselves to the patient observer.
Why do some traders seem to possess an almost preternatural ability to anticipate market movements? The answer often lies not in mystical foresight but in their mastery of technical analysis tools—particularly candlestick charts, which have evolved from their 17th-century Japanese rice trading origins into essential instruments for modern cryptocurrency traders.
Candlesticks, with their distinctive bodies and shadows, provide a visual shorthand of market psychology within specific timeframes.
The body—that rectangular centerpiece—represents the distance between opening and closing prices, while the thin lines extending above and below (the shadows) indicate the high and low extremes reached during the period.
Green or white bodies signal bullish momentum (closing price exceeded opening), while red or black indicate bearish pressure (prices closed lower than they opened). Unlike traditional stock markets, cryptocurrency markets operate 24/7, defining open and close prices solely by the selected timeframe.
The beauty of candlestick analysis lies in its pattern recognition capabilities. Bullish formations such as the Hammer—with its small body and elongated lower shadow suggesting buyers stepping in to reject lower prices—can signal potential reversals after downtrends. Unfortunately, due to new UK rules, certain educational content on cryptocurrency trading might be temporarily unavailable on some platforms. Conversely, bearish patterns like the Shooting Star, basically an inverted Hammer appearing at trend peaks, often presage downward corrections.
More complex arrangements like the Morning Star (a three-candle bullish reversal pattern) or Evening Star (its bearish counterpart) require deeper analytical skills but potentially offer greater predictive value. Identifying support and resistance levels through candlestick formations helps traders determine optimal entry and exit points in the volatile cryptocurrency market. The appearance of Doji candles—where opening and closing prices are virtually identical—typically indicates market indecision and possible trend exhaustion.
Prudent cryptocurrency traders recognize that candlestick patterns, while powerful, should never exist in analytical isolation. Rather, they gain significance when corroborated by volume indicators, support/resistance levels, and other technical tools. The market’s notorious volatility demands this integrated approach.
For best results, traders should evaluate patterns across multiple timeframes, as formations on daily charts may carry more significance than those on minute-by-minute displays. Through consistent practice and disciplined analysis, what initially appears as arcane symbology gradually transforms into a sophisticated language that articulates market sentiment with remarkable clarity.
Frequently Asked Questions
What Candlestick Patterns Indicate a Market Reversal?
Candlestick patterns signaling market reversals include both bullish and bearish formations.
Bullish reversals—such as hammers, morning stars, bullish engulfing patterns, and inverted hammers—typically emerge after downtrends, suggesting imminent upward movement.
Conversely, bearish reversals—including shooting stars, evening stars, bearish engulfing patterns, and hanging men—materialize following uptrends, indicating potential downward pressure.
These patterns (often most reliable when confirmed by volume or other technical indicators) serve as visual manifestations of shifting market psychology and momentum.
How Reliable Are Candlestick Patterns in Cryptocurrency Trading?
Candlestick patterns in cryptocurrency trading offer modest reliability at best—research suggests they accurately predict price movements only about 5.3% of the time when used in isolation.
Their effectiveness improves substantially when combined with other technical indicators, fundamental analysis, and proper market context.
The inherent volatility of cryptocurrency markets often generates false signals, making pattern reliability highly dependent on trader experience and disciplined verification through multiple confirmatory factors rather than standalone interpretation.
Can Candlestick Analysis Work Alongside Other Technical Indicators?
Candlestick analysis works exceptionally well alongside other technical indicators, creating a potent analytical synergy.
Traders regularly combine candlestick patterns with oscillators (RSI, MACD), trend indicators (moving averages), and volume metrics to filter noise and validate signals.
This multi-layered approach—what professionals call “confluence”—significantly enhances decision quality by requiring confirmation across different analytical dimensions.
The background information aptly illustrates this symbiotic relationship, where candlesticks provide the visual narrative while indicators supply the mathematical validation necessary in cryptocurrency’s volatile landscape.
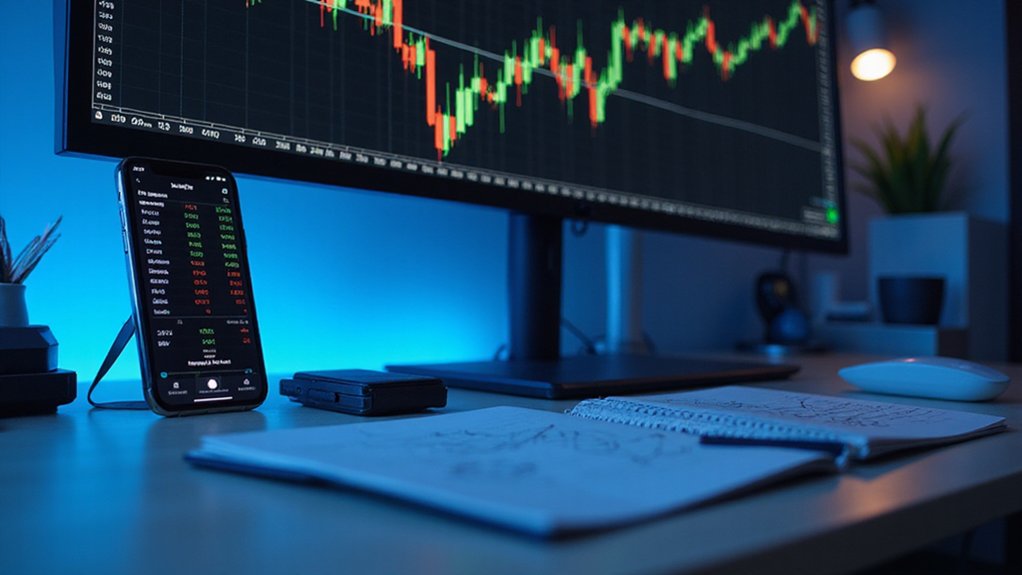
What Timeframes Work Best for Candlestick Analysis in Crypto?
For crypto candlestick analysis, timeframes should align with one’s trading strategy.
Day traders might leverage 5-15 minute charts to capture volatility spikes, while swing traders typically find 4-hour to daily charts more reliable for pattern formation.
The 24/7 nature of crypto markets (unlike their traditional counterparts) often renders weekly charts particularly illuminating for macro trends.
Ultimately, the ideal timeframe isn’t universal—it’s the one that filters out noise while preserving actionable patterns for one’s specific trading horizon.
How Do Volume Indicators Complement Candlestick Patterns?
Volume indicators serve as critical validation mechanisms for candlestick patterns, transforming potentially ambiguous price formations into actionable trading signals.
High volume during bullish patterns confirms genuine momentum, while suspiciously low volume during breakouts often presages false moves (the market’s equivalent of writing checks it can’t cash).
Volume divergence from price action reveals exhaustion before it becomes apparent in candlesticks alone, while volume-weighted technical tools—particularly during consolidation phases—help distinguish between noise and legitimate accumulation zones.