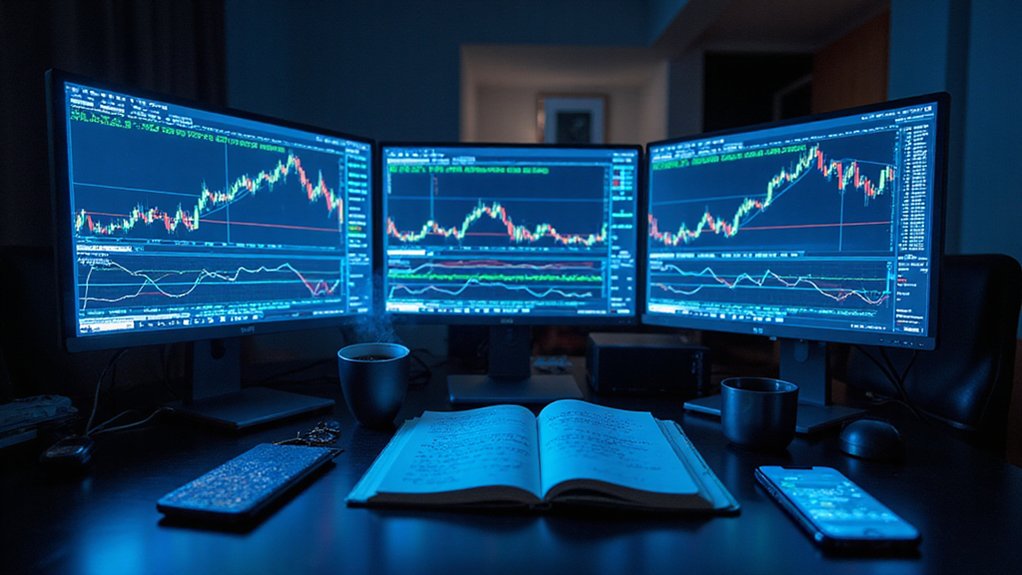

Reading cryptocurrency charts effectively requires understanding several key elements. Start with chart types (candlesticks provide the most detailed data), then identify patterns like double tops or head-and-shoulders formations which signal potential reversals. Supplement visual analysis with technical indicators such as MACD and RSI to confirm trends and identify overbought/oversold conditions. Volume analysis adds vital context to price movements. Successful traders combine these technical insights with risk management principles—a methodical approach separates disciplined investors from those merely chasing market phantoms.
Why do cryptocurrency charts often resemble indecipherable hieroglyphics to the uninitiated observer?
These visual data representations—essential for traders maneuvering the volatile waters of digital assets—require methodical interpretation rather than cursory glances.
The ability to decode these graphical narratives separates successful investors from those perpetually chasing the market’s capricious tail.
Chart selection provides the foundation for proper analysis.
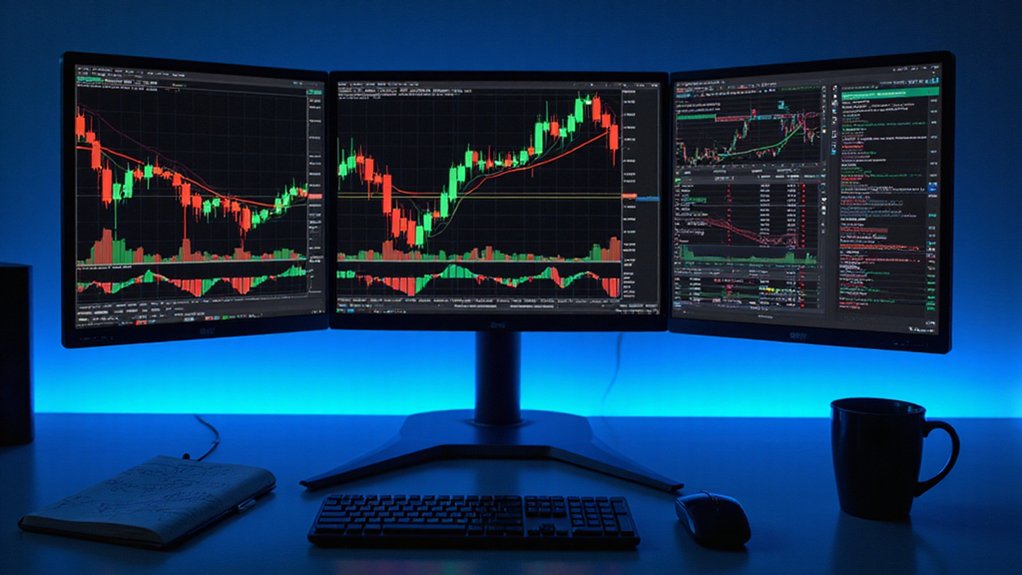
While line charts offer streamlined trend identification through closing prices, bar charts and candlesticks deliver richer data sets including opening, high, low, and closing values—the latter being particularly prized for their intuitive visual cues signaling market sentiment.
Candlestick charts are especially valuable as each candlestick displays price movement components including the real body, wicks, and color to visually communicate market behavior during specific time periods.
For those seeking respite from market noise, Renko and Heikin-Ashi charts filter extraneous fluctuations, crystallizing genuine price movements.
Pattern recognition constitutes the cornerstone of chart analysis.
Reversal formations such as head-and-shoulders or double tops/bottoms portend directional shifts, while continuation patterns (triangles, wedges) suggest momentary pauses before trend resumption.
The astute observer identifies these configurations not as mere geometric curiosities but as psychological manifestations of market participants’ collective behavior.
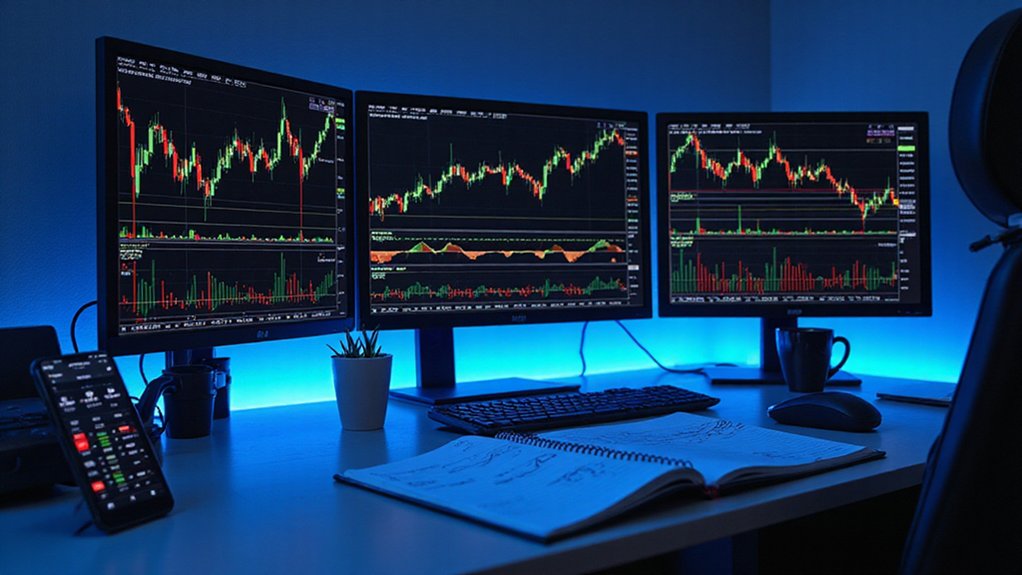
Technical indicators supplement pattern analysis by quantifying market conditions.
MACD illuminates momentum trends, RSI reveals overbought or oversold territories, and Bollinger Bands frame volatility parameters.
These mathematical formulae, when judiciously applied, transform subjective interpretations into objective assessments¹.
The ultimate mastery of cryptocurrency charting emerges from synthesizing multiple analytical approaches.
Combining trendlines with support/resistance identification, incorporating volume analysis alongside price action, and contextualizing technical signals within broader market fundamentals creates a thorough analytical framework.
Successful investors prioritize fundamental analysis over simply following price trends and graphics when evaluating a cryptocurrency’s actual investment value.
Technical analysis assumes that prices move in trends and that historical price patterns tend to repeat themselves, making chart interpretation crucial for anticipating future market movements.
Perhaps most essential (yet frequently overlooked) is establishing methodical risk management through strategic stop-loss placement and realistic profit targets.
Cryptocurrency charts, properly understood, transcend mere price tracking to become dynamic narrative devices revealing market psychology, participant behavior, and potential future movements.
Their interpretation, while never guaranteeing outcomes in these mercurial markets, substantially improves decision-making quality by replacing emotional reactions with evidence-based analysis.
¹Though no indicator boasts infallible predictive capacity—a reality many vendors conveniently omit from their marketing materials.
Frequently Asked Questions
How Do I Identify Potential Pump-And-Dump Schemes in Crypto Charts?
Astute traders identify pump-and-dump schemes through several telltale chart patterns: abnormal volume spikes preceding price surges (particularly in low-liquidity assets), parabolic price increases without fundamental catalysts, and extreme RSI readings above 90.
The manipulation footprint typically includes shallow retracements, multiple upper wicks on candlesticks, and—most damningly—precipitous price collapses following the peak.
These schemes often coincide with coordinated social media hype and concentrated activity on less-regulated exchanges.
What Tools Can Integrate With Exchange Platforms for Real-Time Analysis?
Several sophisticated tools can integrate with exchange platforms for real-time analysis.
API-based integration platforms connect to 300+ exchanges, providing normalized data streams and live metrics across thousands of cryptocurrencies.
Portfolio trackers sync exchange accounts for instant portfolio valuation and tax reporting.
Market data platforms deliver institutional-grade analytics with websocket capabilities for live order book monitoring.
Specialized blockchain compliance tools offer transaction tracing and risk management—essential resources for traders maneuvering markets where a five-minute delay might as well be five centuries.
How Do Chart Patterns Differ Between Established Cryptocurrencies and New Tokens?
Chart patterns in established cryptocurrencies display greater reliability, with longer-duration formations and clearer support/resistance levels yielding success rates above 60% for triangles and head-and-shoulders patterns.
Conversely, new tokens exhibit compressed timeframes and erratic volume, producing distorted patterns riddled with false breakouts and whipsaws.
The liquidity gap is particularly telling—mature assets form deliberate, symmetrical patterns reflecting institutional participation, while new tokens fall prey to FOMO-driven truncations and hyperbolic post-pattern moves.
Can Chart Analysis Predict Government Regulatory Impacts on Cryptocurrencies?
Chart analysis can indicate potential regulatory impacts through pattern recognition, but predicting government actions remains an inexact science.
While technical indicators may capture market sentiment preceding regulatory announcements (particularly through volume spikes and volatility patterns), they cannot reliably forecast the timing or specific nature of regulatory decisions.
Historical precedent offers clues—markets typically exhibit recognizable reactions to similar regulatory events—but chart analysis ultimately serves better as a reaction gauge than a crystal ball for government intervention.
How Reliable Are Chart Patterns During Extreme Market Volatility?
Chart patterns become notoriously unreliable during extreme volatility, with their predictive power diminishing as market irrationality reigns supreme.
Traders who place blind faith in textbook formations during such periods might as well consult astrological charts (perhaps with similar results).
The prudent approach involves multi-timeframe confirmation, volume validation, and volatility-adjusted stop losses—though even these measures offer no guarantees when markets experience those spectacular, fundamentals-defying moments that cryptocurrencies seem particularly fond of producing.